Welcome
Does the thought of having to interpret a patient's ECG cause a sense of impending doom? Does looking at those squiggly lines make you sweat? It might mean you're having a heart attack. Alternatively, and more likely, it means you need a bit of guidance on how to approach this field of "magic medicine."
Understanding and experience with ECGs varies enormously between individuals. We come from a variety of backgrounds and specialisms, so this series approaches from the assumption that the reader knows nothing, and builds up from there, one self-contained concept at a time.
"Each concept is made into a self-contained module... this resource is open to yourself to refer back to and proceed at your own pace."
The core concepts
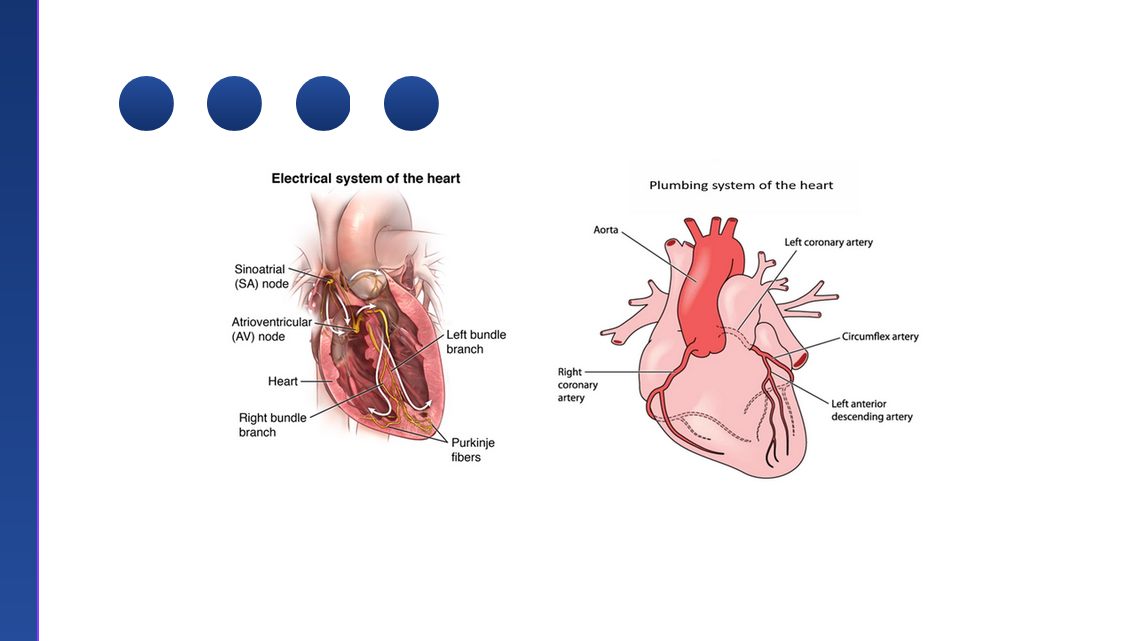
It is easier to divide ECGs into observing two core themes of the heart:
- The electrics is the conduction system: bundle branches, the SA and AV nodes, and everything that carries the depolarisation signal.
- The plumbing is the coronary arteries that supply the muscle doing the actual contracting.
Almost everything an ECG shows you is a consequence of a problem with one of these two systems, and knowing which one you're looking at is the first filter for interpretation.
Views & territories
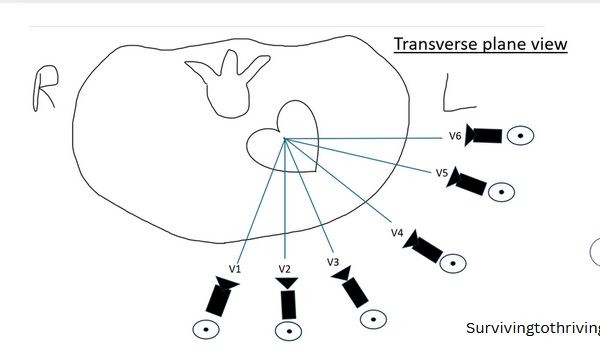
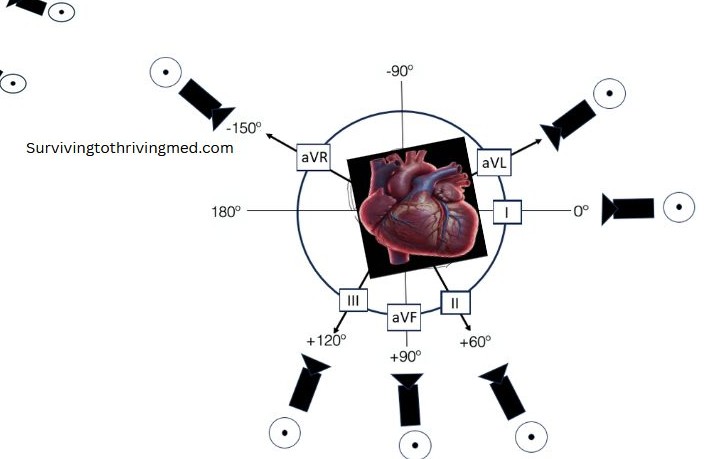
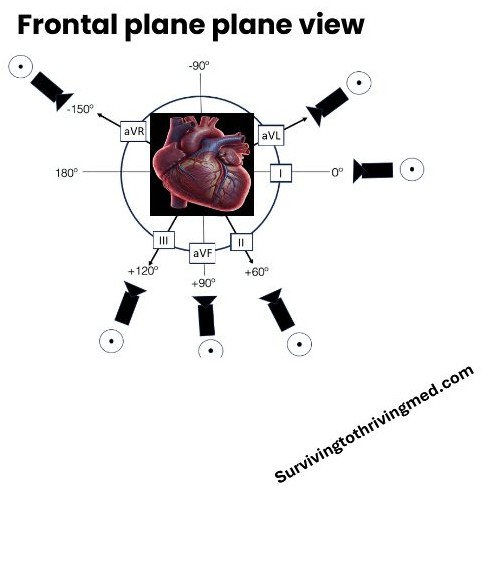
Each of the 12 leads is only a "camera angle": it can only see electrical activity moving towards it (positive deflection) or away from it (negative deflection). Interpreting a single isolated lead is a fool's errand; leads are grouped into territories that view the same region of heart muscle from a similar angle:
This is the "cinematic approach": because every lead is recording the same electrical event from a different angle, the same beat must be internally consistent across all twelve. When one lead's morphology looks ambiguous (narrow vs. broad, for example), cross-reference the other leads recording the same beat; they can resolve the ambiguity for you.
Axis calculation
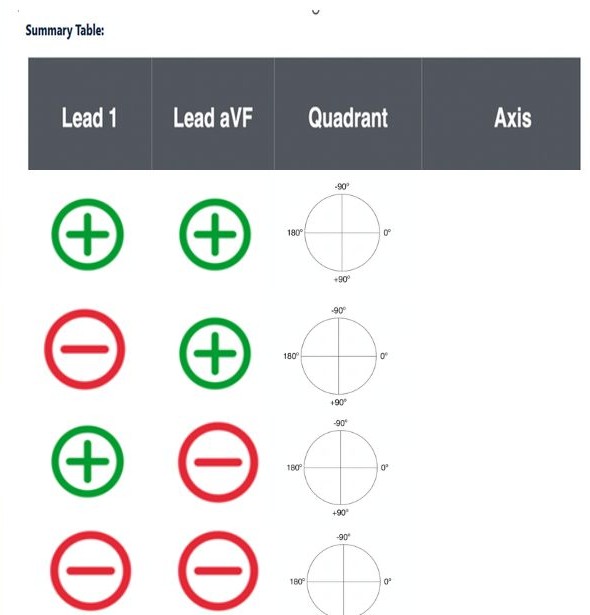
Because leads only see in positive and negative vectors, we can use that to determine the heart's electrical axis. The simplest method needs only two leads, Lead I and aVF, interrogated for whether their deflection is predominantly positive or negative:
I (–), aVF (+) → Right axis deviation
I (+), aVF (–) → Possible left axis deviation
I (–), aVF (–) → Extreme axis deviation
This is the "quadrant approach": it doesn't require memorising which leads "reach" or "leave" one another, just two positive/negative checks.
Rate calculation
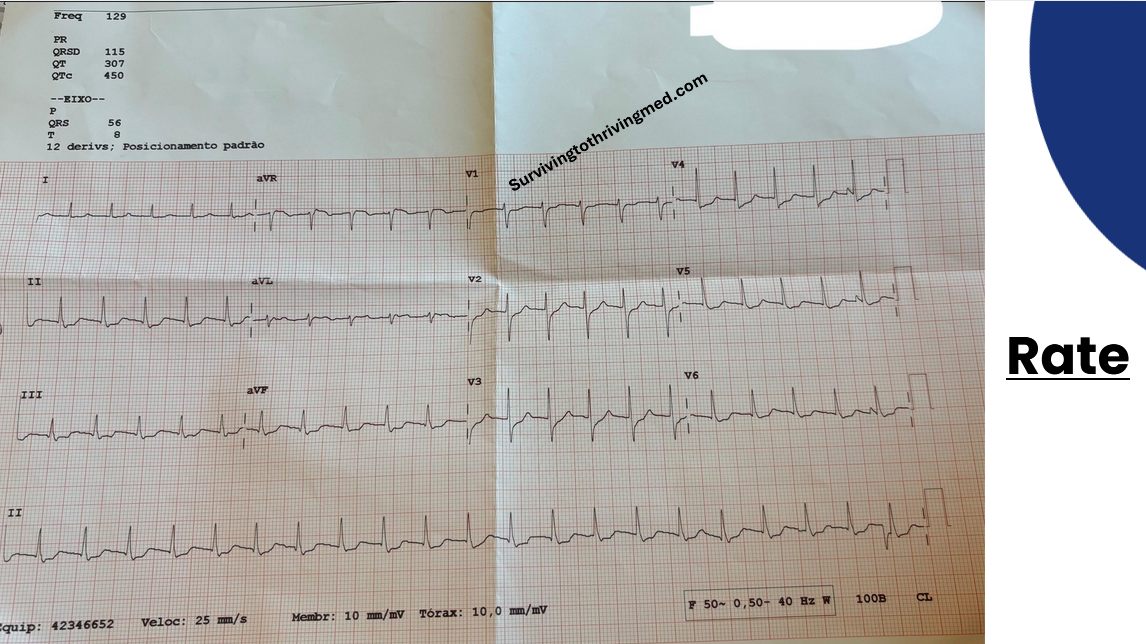
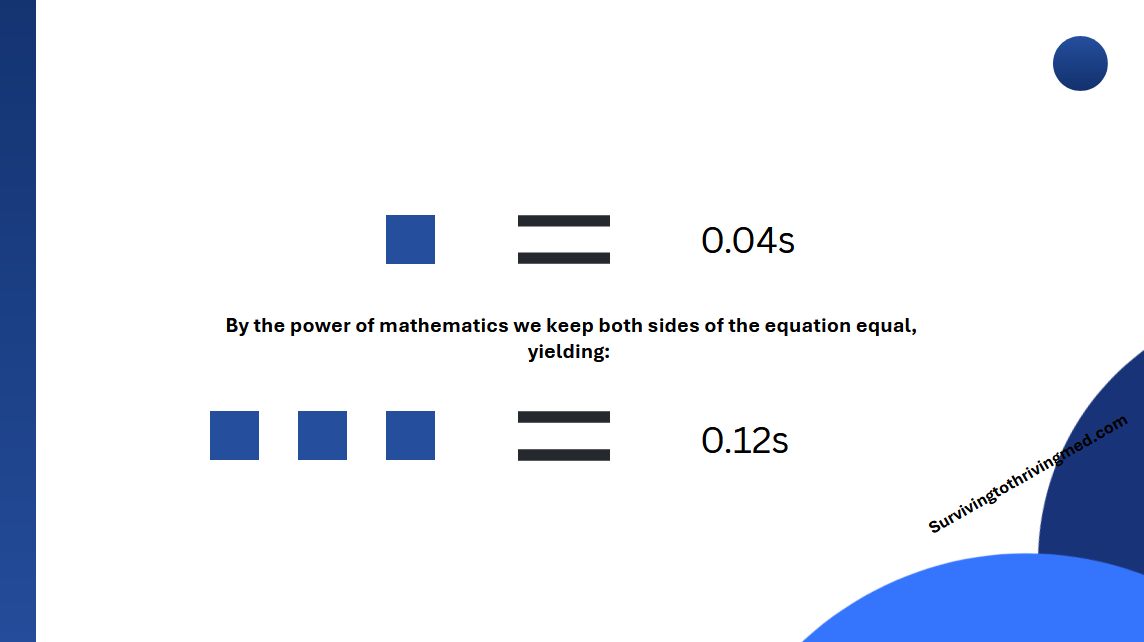
The one part of a machine-reported ECG that must always be interrogated is the calibration: standard is 25mm/sec paper speed and 10mm/mV voltage. That makes one small square 0.04s / 0.1mV, and one large square (5 small squares) 0.2s / 0.5mV. This is the basis for essentially every ECG time-based definition, including "broad complex" (>0.12s, i.e. 3 small squares).
Two practical rate methods:
- The ×6 method: count the QRS complexes across a 10-second strip and multiply by 6. Works well for regular-ish rhythms.
- The 300 method: count the large squares between two consecutive R waves and divide 300 by that number. Better for fast, regular rhythms.
Do not blindly trust the machine's printed rate: it can be wrong, particularly with artefact or irregular rhythms. "Everybody lies. Machines included."

The P wave
Before analysing P waves at all: rule out a peri-arrest rhythm first. VF and asystole don't need P-wave analysis, they need the ALS algorithm: sensitivity over precision when the patient doesn't have a pulse.
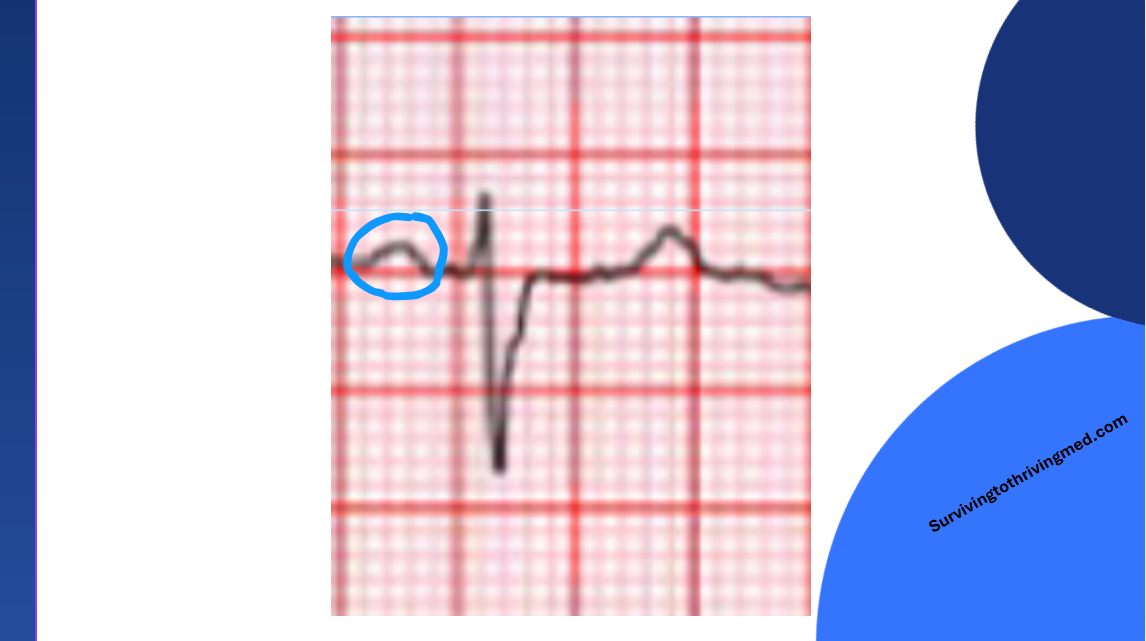
The P wave represents atrial depolarisation. The SA node sits in the right atrium, and the right and left atria depolarise in sequence via Bachmann's bundle, which is why V1 (closest to the SA node, and roughly perpendicular to the wave of depolarisation) commonly shows a biphasic P wave, while the P wave is normally inverted in aVR.
A P wave inverted in lead II with an otherwise normal QRS axis suggests an ectopic atrial rhythm: the atria are depolarising from somewhere other than the SA node, but the ventricles are still conducting normally.
Normal P wave: duration ≤0.12s, amplitude <2.5mm in the limb leads / <1.5mm in the precordial leads.

The PR interval
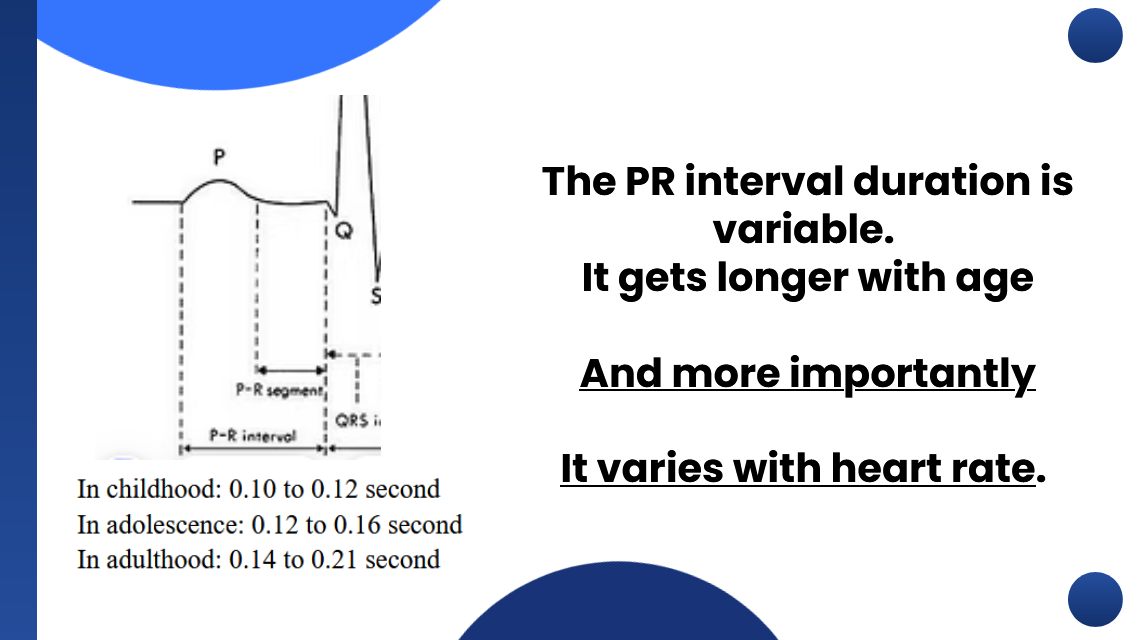
The PR interval and PR segment are different things: the interval runs start-of-P to start-of-QRS; the segment is the flat bit in between, representing the physiological delay at the AV node while the atria finish emptying into the ventricles.
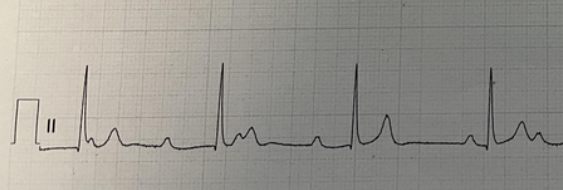
Normal PR interval is 0.12–0.20s (3–5 small squares). Longer than that implies delay somewhere in the conduction pathway, most often at the AV node itself, giving first-degree heart block.
The Q wave
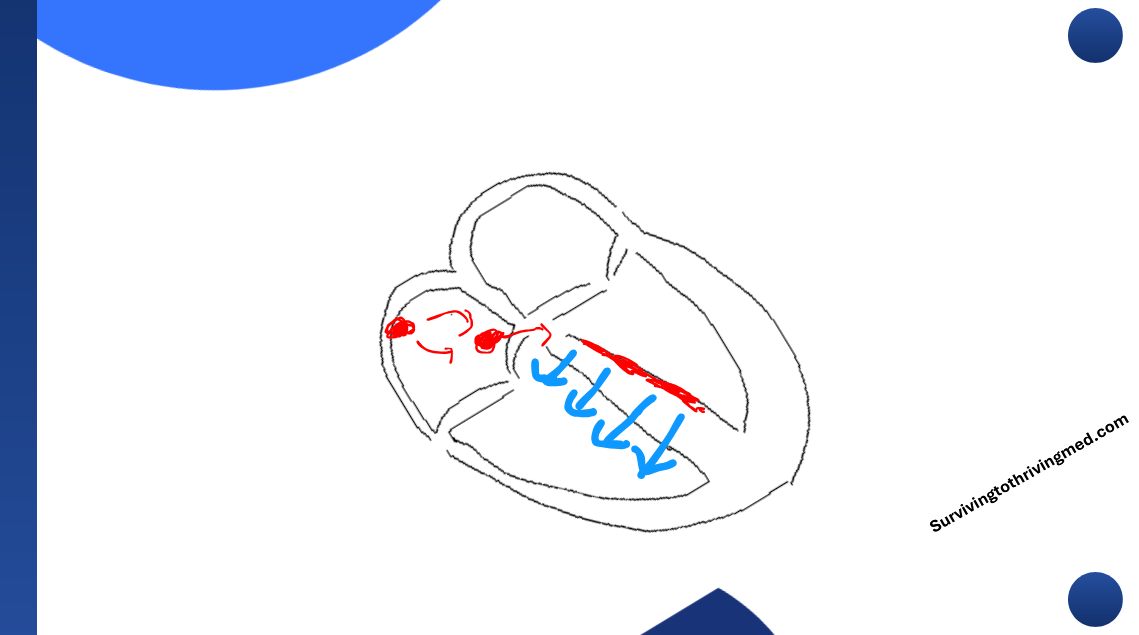
The interventricular septum is depolarised first, and (critically) it is supplied only by the left bundle branch, so it always depolarises left-to-right. That means anterior leads (V1–V4), which face this rightward-moving vector, should never show a Q wave normally. If they do, it's pathological (classically, prior anteroseptal infarction).
Conversely, the absence of the expected small septal Q wave in the lateral leads (I, aVL, V5, V6) is also abnormal, seen in LBBB and some infarcts, since the normal leftward septal vector isn't there to produce it.
Referenced source: Palmeri et al., "A QRS Scoring System for Assessing Left Ventricular Function after Myocardial Infarction," NEJM, 1982.

The R wave
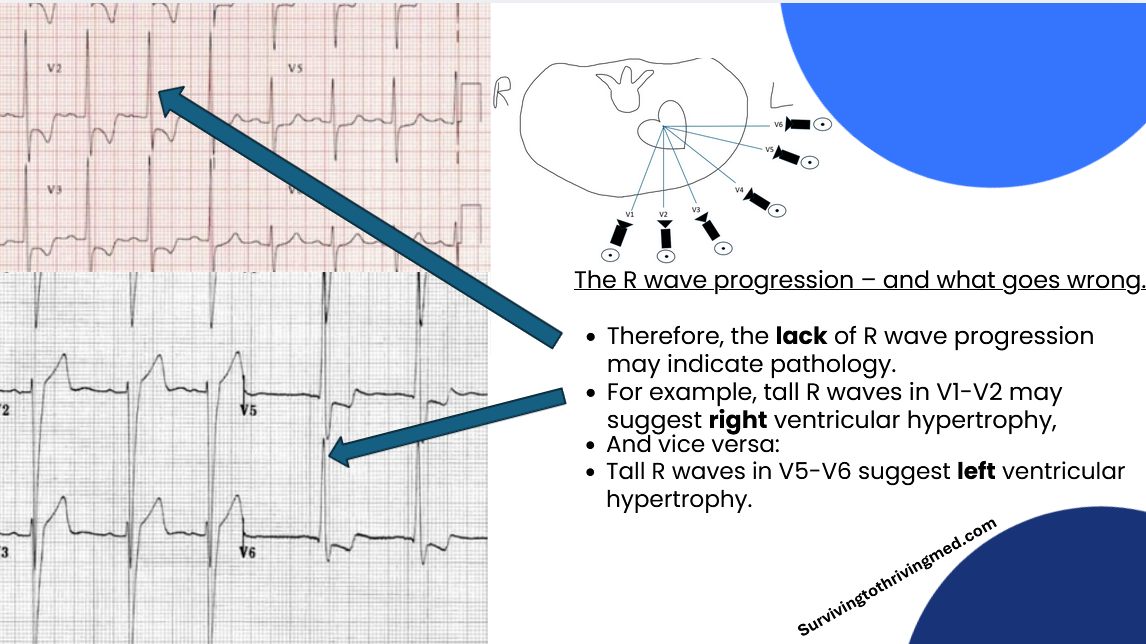
R-wave progression: leads that are more "head-on" to the direction of ventricular depolarisation (V3/V4) show taller R waves; leads further from that angle (V1, V5/V6) show smaller ones. Deviation from that normal taper, termed poor R-wave progression, implies pathology, up to and including a large anterior infarct.
Amplitude is measured from the most positive to the most negative point of the whole QRS complex, not tied to one specific wave: a subtlety that trips people up.
Low voltage QRS causes: obesity, pericardial effusion, COPD/hyperinflation, hypothyroidism, amyloid/infiltrative disease: anything that increases the distance or impedance between the heart and the electrodes, or genuinely reduces myocardial mass generating the signal.
Intrinsicoid deflection, the time from QRS onset to the peak of the R wave, is a real but rarely-used measure of conduction delay through the ventricular wall, historically used to help characterise bundle branch blocks. In practice, axis and morphology usually tell you more, faster.
The S wave
The S wave is the mirror image of the R wave: once the depolarisation wave reaches the apex, it turns back "up" the ventricular walls, reversing direction relative to most leads. There isn't a separate "S-wave progression" concept taught, because by definition it's the inverse of R-wave progression: if you understand one, you understand the other.

The QRS complex
QRS amplitude naturally increases through early-to-middle adulthood then tails off with age, one of many reasons modern cardiology favours relative and pattern-based reasoning over rigid absolute-value cutoffs.
QRS width (normal <0.12s / 3 small squares) is itself a somewhat historical/statistical cutoff rather than an immutable law of physiology, worth remembering when a complex sits right on the boundary and doesn't fit the textbook category cleanly. Rules built for populations don't always resolve individual, unusual physiology at the edges.
The ST segment

The reader may be confused why an image of a BMW has been inserted into an ECG teaching series. The answer is pretty simple: they're pretty similar. The ST segment is generally the loud and flashy part of the ECG that everyone gets fixated about, and it is unfortunately not a joke that a great deal of clinical ability in ECG interpretation is simply "Is it a STEMI?"
They are an absolute pain, and you cannot ignore them. If you are unaware of their existence, that bodes ill for everyone involved. It is rare that they are not brutally direct, and indeed they don't tend to give a damn about what else is going on in your world that moment; they need priority, first and foremost. They come in various shapes, sizes, ages, and have a habit of ruining your day at the worst possible moment.
The fact that you, the reader, have read this section and have no idea whether the above refers to a BMW or a STEMI proves the point.
Physiologically, the ST segment is the period between ventricular depolarisation (the QRS complex) and ventricular repolarisation (the T wave), normally flat and isoelectric.
The single most useful habit: compare the ST segment to the TP segment (the flat stretch between the T wave and the next P wave), not to an assumed flat baseline. That comparison is what reveals subtle elevation or depression that a glance would miss.
The J point is simply the junction between the end of the QRS complex and the start of the ST segment, the point elevation or depression is actually measured from. It's a simple concept that's easy to lose track of on a busy, notched, or sagging complex.

The T wave
The T wave represents ventricular repolarisation. Normally it should be relatively smooth and positive in most leads (inverted in aVR, and sometimes V1).
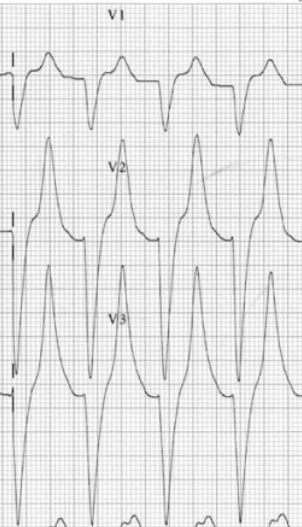
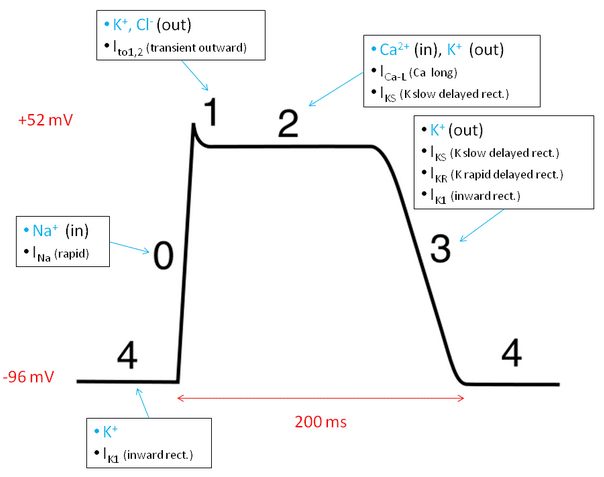
Repolarisation depends on the same ion channels (Na⁺, Ca²⁺, K⁺) that drive the cardiac action potential, so anything that disrupts those channels, congenital (Long QT syndrome) or acquired (tricyclic overdose, electrolyte derangement), shows up as T-wave abnormality. The classic example: tall, tented T waves in hyperkalaemia.
T-wave changes are markedly non-specific: inverted, peaked, flattened, or oversized T waves can all be normal variants or genuinely pathological, and telling the two apart depends on the clinical context, not the ECG alone.
The QT segment
The QT interval is measured from the start of the Q wave to the end of the T wave. Because the true end of the T wave can be hard to pin down on a sloped or notched wave, the standard technique is the tangent method: draw a line along the steepest part of the T wave's downslope, and take where it crosses the isoelectric baseline as the endpoint.
>500ms = "at risk" of Torsades de Pointes
QT varies with heart rate (faster rates shorten it, slower rates lengthen it), so it needs correcting to QTc for comparison. Bazett's formula is the most commonly used:
One important exception: in some clinical contexts (poisoning being the classic one), the raw QT is what's actually asked for, not the corrected QTc.
If a patient is in Torsades de Pointes: IV magnesium if they have a pulse; defibrillation if they don't.
An approach to heart blocks
Important distinction: "normal sinus rhythm" does not mean "no abnormality detected." Sinus rhythm only tells you two things: that the impulse originates from the SA node, and that it propagates down the expected pathway (SA node → atria → AV node → His bundle → bundle branches → ventricles) in the correct sequence. Everything else (rate, intervals, morphology) still needs separately checking.
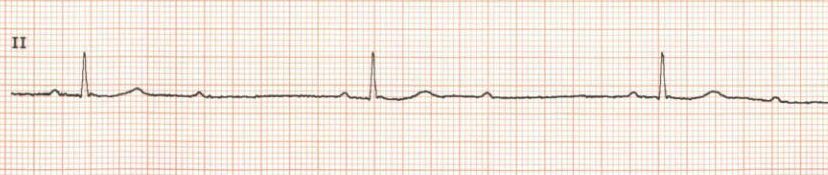
The framework for heart blocks is simple: does every P wave have a QRS, and does every QRS have a P wave?
3rd degree (complete) heart block is the easiest to spot electrographically: the P waves and QRS complexes are completely dissociated, "not talking to each other." There's a full disconnection between atrial and ventricular activity. Not every case needs a pacemaker, but many do.
1st degree heart block: every P has a QRS in a clean 1:1 ratio, but the PR interval is fixed and prolonged (>0.2s). Almost always benign.
2nd degree heart block sits in between: some, but not all, P waves are followed by a QRS. In both Mobitz types, the P-P interval stays fixed (the atria keep their own regular rate regardless of what the ventricles do):
- Mobitz type 1: "going, going, gone." The PR interval progressively lengthens beat-on-beat until one QRS is dropped entirely (Wenckebach), then the cycle resets. Caused by AV-nodal fatigue; generally benign.
- Mobitz type 2: the PR interval and the P:QRS conduction ratio are both fixed, conduction is all-or-nothing. Usually caused by structural disease below the AV node (infra-nodal), and is the more concerning type. Often described by its AV block ratio (e.g. 2:1, 3:1, meaning how many P waves per QRS).
Quick discriminator: if the P:QRS ratio isn't a clean 1:1, check whether the PR interval is fixed. Fixed and prolonged → type 2. Progressively lengthening until a drop → type 1.

Putting it all together
Approaching ECG interpretation from the perspective of "sensitive, not specific" is completely fine: it's sufficient for advanced life support, and if you can detect that something is wrong, you can always ask someone more experienced to be more specific about exactly what it is.
By this stage, a systematic run-through should let you answer, in order:
- Is the rhythm compatible with a pulse?
- What is the axis?
- What is the heart rate?
- Is it regular or irregular?
- Is the QRS complex narrow or wide?
- Are there P waves?
- Is the PR interval normal?
- Are the P and QRS waves in a 1:1 ratio, interacting normally?
- Are there any (anterior or absent-lateral) Q wave problems?
- Is R-wave progression normal?
- Is the ST segment on the baseline, compared fairly against the TP segment?
- Are there any major T wave problems?
- Is the QT interval normal?
Run through a real example against that list and you'll find you can commit to "normal sinus rhythm" with a straight face on plenty of strips, while the framework also flags anything that doesn't fit, forcing you to look closer rather than pattern-match and move on.
For real-world worked examples applying this framework to specific cases (PPCI decision-making, arrhythmias, and bundle branch blocks), see the ECG Case Studies page.